Debugging plugins
ONLYOFFICE plugins are debugged with the browser DevTools. In the web editors, open them as usual, for example with F12. In the desktop editors, start the application with the --ascdesktop-support-debug-info flag, then click anywhere in the document and press F1, or right-click a toolbar field and select Inspect Element. See Debugging for how to set the flag on each operating system.
Which frame your code runs in
A plugin's code runs in two frames:
| Code | Runs in |
|---|---|
The plugin's own code: scripts loaded by index.html, Asc.plugin.init, event handlers, executeMethod callbacks | The plugin iframe, iframe_<guid>, where <guid> is the plugin guid |
The function passed to callCommand | The editor frame, frameEditor |
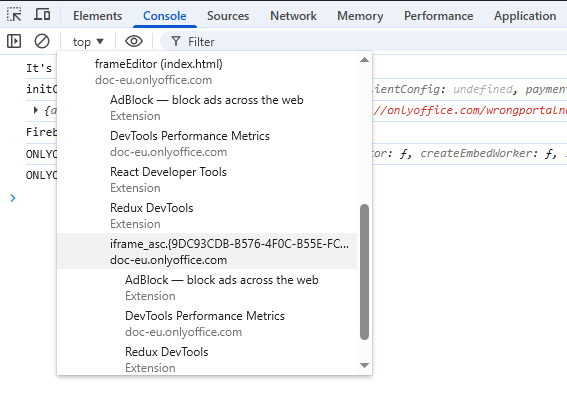
The function passed to callCommand does not run where you wrote it. The plugin converts it to a string, sends it to the editor, and the editor evaluates it. As a result:
- The function cannot see the plugin's variables. Pass values through
Asc.scope, which is serialized to JSON: functions, DOM nodes, and class instances are silently lost or arrive as plain objects. - Errors thrown inside the function are reported by
frameEditor. Atry...catcharound thecallCommandcall in the plugin does not catch them. - In the Sources tab, the function appears as an anonymous VM script, not as your plugin file, so breakpoints set in your file are not hit. Use
debuggerinstead. - To get a result back into the plugin, return it from the function and read it in the
callCommandcallback.
Debugging callCommand code
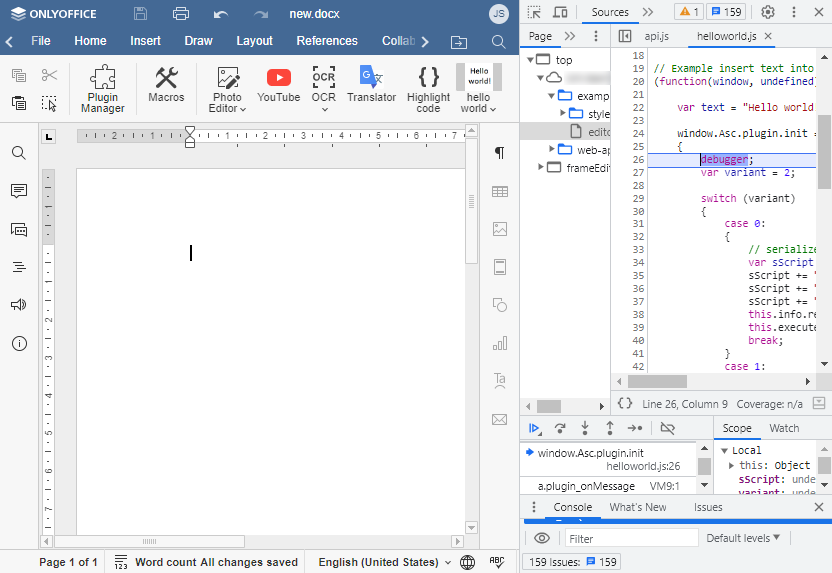
A debugger statement inside callCommand pauses execution in frameEditor:
(function (window, undefined) {
  window.Asc.plugin.init = function () {
    Asc.scope.text = "Test Example"; // Pass the value to the editor frame

    this.callCommand(function () {
      debugger; // Pauses in frameEditor
      var oDocument = Api.GetDocument();
      var oParagraph = Api.CreateParagraph();
      oParagraph.AddText(Asc.scope.text);
      oDocument.InsertContent([oParagraph]);
    });
  };
})(window, undefined);
Open DevTools first: if they are closed, the browser ignores debugger. Then open the Plugins tab and run the plugin. Execution stops at the debugger line:
Debugging checklist
- Confirm the plugin is installed and enabled.
- Ensure all files (
index.html,config.json,assets) are present and reachable. - Validate the
config.jsonstructure and paths.
For more problems and their fixes, see Common errors and solutions.