调试插件
ONLYOFFICE 插件使用浏览器开发者工具进行调试。在 Web 编辑器中,按常规方式打开开发者工具,例如按 F12。在桌面编辑器中,使用 --ascdesktop-support-debug-info 标志启动应用程序,然后在文档中的任意位置单击并按 F1,或者右键单击工具栏字段并选择检查元素。有关在各操作系统中设置该标志的方法,请参阅调试。
代码在哪个框架中运行
插件代码在两个框架中运行:
| 代码 | 运行位置 |
|---|---|
插件自身的代码:index.html 加载的脚本、Asc.plugin.init、事件处理程序、executeMethod 回调 | 插件 iframe iframe_<guid>,其中 <guid> 是插件的 guid |
传递给 callCommand 的函数 | 编辑器框架 frameEditor |
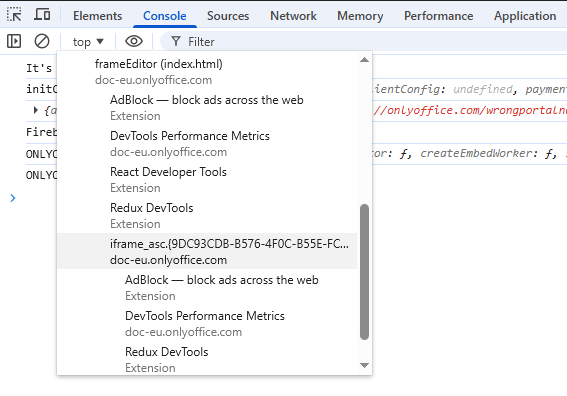
传递给 callCommand 的函数并不在您编写它的地方运行。插件会将其转换为字符串并发送给编辑器,由编辑器执行。因此:
- 该函数无法访问插件中的变量。请通过
Asc.scope传递值,Asc.scope会被序列化为 JSON:函数、DOM 节点和类实例会被静默丢弃,或以普通对象的形式传递。 - 函数内部抛出的错误由
frameEditor报告。在插件中包裹callCommand调用的try...catch无法捕获这些错误。 - 在 Sources 选项卡中,该函数显示为匿名 VM 脚本,而不是您的插件文件,因此在插件文件中设置的断点不会被触发。请改用
debugger。 - 要将结果传回插件,请在函数中返回该值,并在
callCommand的回调中读取。
调试 callCommand 代码
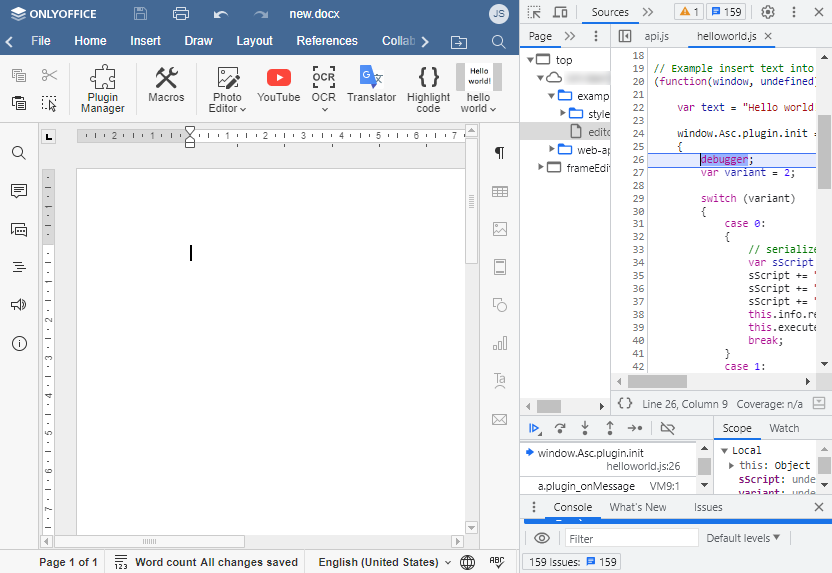
callCommand 内部的 debugger 语句会在 frameEditor 中暂停执行:
(function (window, undefined) {
  window.Asc.plugin.init = function () {
    Asc.scope.text = "Test Example"; // Pass the value to the editor frame

    this.callCommand(function () {
      debugger; // Pauses in frameEditor
      var oDocument = Api.GetDocument();
      var oParagraph = Api.CreateParagraph();
      oParagraph.AddText(Asc.scope.text);
      oDocument.InsertContent([oParagraph]);
    });
  };
})(window, undefined);
请先打开开发者工具:如果开发者工具未打开,浏览器会忽略 debugger。然后打开插件选项卡并运行插件。执行将在 debugger 所在行停止:
调试检查清单
- 确认插件已安装并启用。
- 确保所有文件(
index.html、config.json、assets)都存在且可访问。 - 验证
config.json的结构和路径。
更多问题及其解决方法,请参阅常见错误及解决方案。